CMMS Charting, Data Analysis and OEE
-
What is CMMS charting and data analysis?
-
How do I create a chart?
-
How does CMMS charting and data analysis benefit my organization?
What is CMMS Charting and Data Analysis?
CMMS charting and data analysis capabilities set this CMMS software apart from all of the others. The original designers of MaintSmart wanted to reward the end-users for entering data into the CMMS. While benefits are gained from work orders, preventative maintenance task lists and other basic CMMS reporting, this system also provides extensive analysis and charting of all data entered. As a result MaintSmart provides several powerful analysis and charting tools that are simple to use and benefit from as follows:
- Drag and drop query-builder with statistical analysis and charting for all CMMS data.
- Direct export to Excel of all data.
- Crystal Reports reporting with statistic and charts.
- OLE automation data exports for all analysis screens.
- Charts of hot sheet for quick view of important maintenance management items.
- Complete Overall Equipment Effectiveness (OEE) module with charting.
- Reliability Analysis software module exports to Excel.
- Cost to Own Equipment reports and charts overall equipment cost to own.
In conclusion MaintSmart CMMS software is unlike any other with its powerful suite of analysis tools and reporting options, all included in the basic program.
How Do I Create a Chart?
There are several ways to create a chart with this CMMS. First of all the File>>Report menu on the analysis and reporting screens provide Crystal Reports, that in many case, display a chart with the data. Another way is to use the CMMS OLAP tool available on every screen. With this tool you drag and drop fields needed and the chart is built automatically as you go.
The analysis and reporting screens provide a way to link the queried data to Excel. This is not a simple import to Excel but is MaintSmart actually controlling Excel with instructions behind the scenes. This method (OLE Automation) leverages all of Excels’ powerful features generating a chart with appropriate labels and even a description of what the data represents.
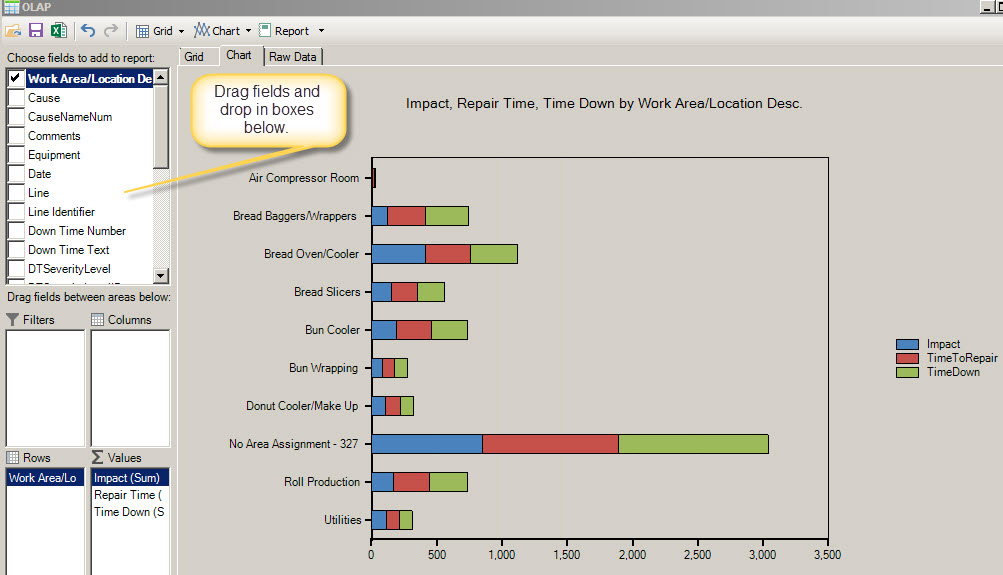
CMMS Charting with Query Builder
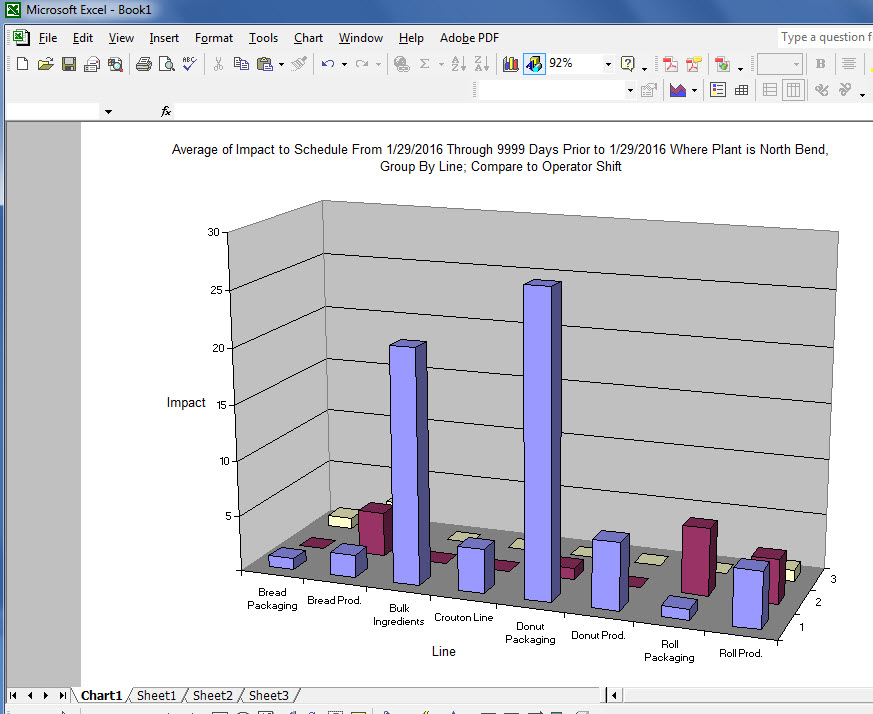
CMMS Charting Excel Automation Report
How Does CMMS Charting and Data Analysis Benefit My Organization?
CMMS charting and data analysis provide powerful answers regarding:
- Reoccurring equipment problems (count).
- Breakdowns that result in a large cumulative time loss and/or periodic major breakdowns (sum and count).
- Higher than average breakdown rate for similar equipment or all equipment compared to shift, operator or other filter (average).
- Cost of spares purchased for particular reasons.
- Overall cost of each equipment item. This includes all costs for work orders, preventative maintenance, downtime and spares used for any reason.
- Reporting of why spares are used.
- Reports for who is using spares.
- Cost of purchased items by vendor, account, cost center or other grouping.
- Overall Equipment Effectiveness (OEE) module comes complete with the base software module. Many of our competitors talk about OEE but do no offer it or charge to provide it.
OLAP Query Builder (4:11)
CMMS Charting and Data Analysis (9:04)
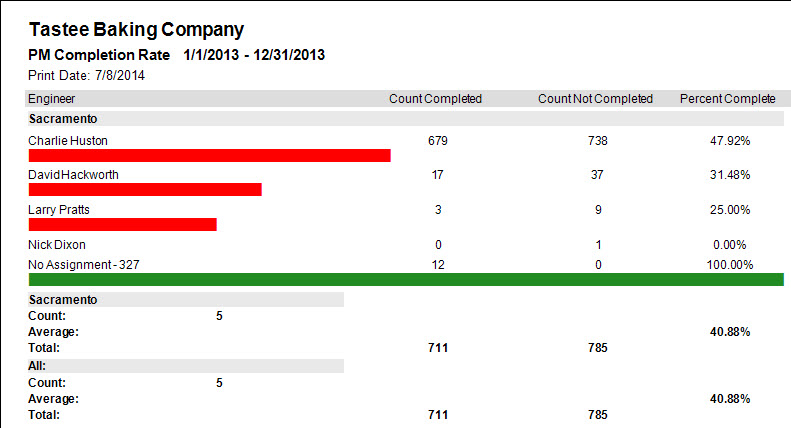
Preventative Maintenance Percent of Completion Report
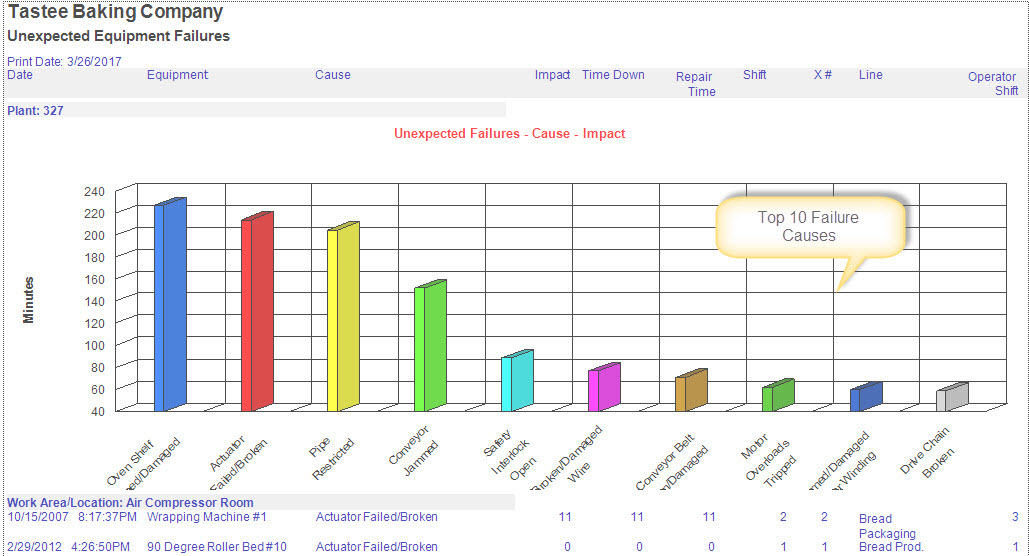
CMMS Charting for Top 10 Downtime Causes